
Show Your Clients
the Power of
Protected Growth:
Get FREE Access to the Real Return Reporter™ Software, powered by GBU Life, A Powerful Visual Tool.
See It For Yourself First, Then Show Your Clients with Complete Confidence
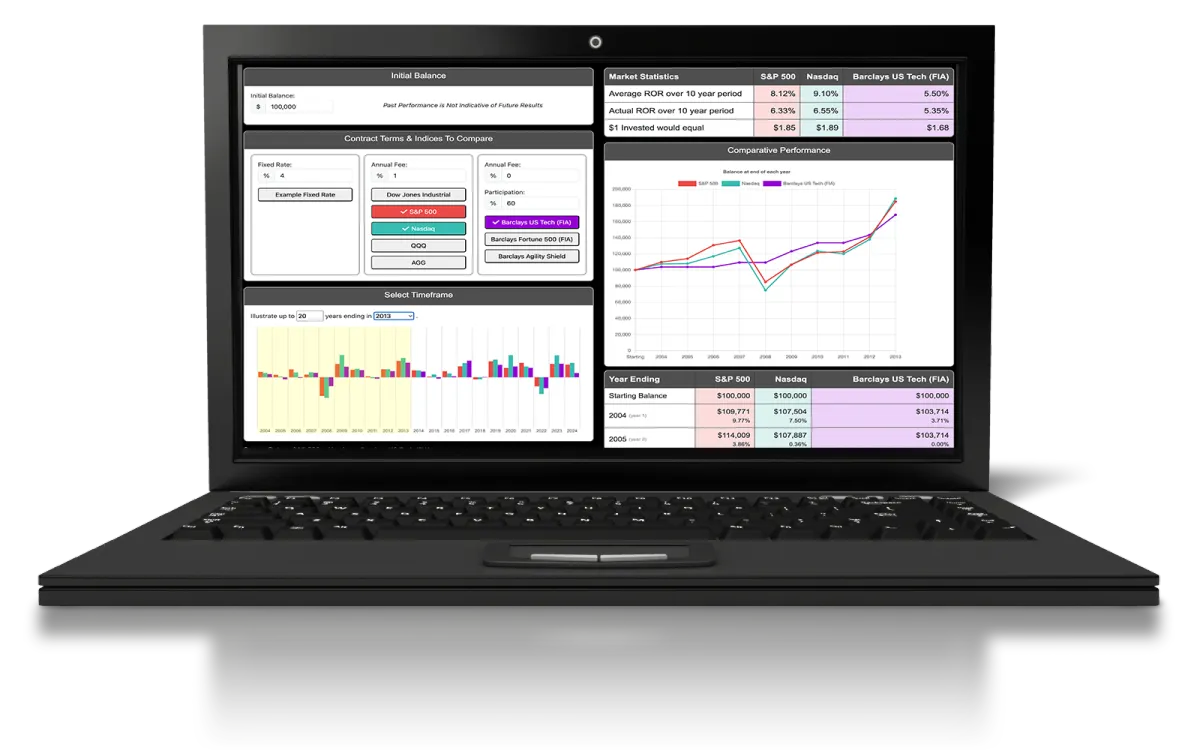
Before you present to a single client, the Real Return Reporter™ let's you explore historical index performance for yourself. When you witness firsthand how this solution performs compared to traditional retirement planning options - especially during market volatility - you'll present with absolute conviction because you've seen the proof with your own eyes.
Core Benefits Of The Real Return Reporter™

Transform Your Client
Conversations with Visual Proof
• Transform complex market comparisons into clear, visual evidence that instantly demonstrates the value of GBU Life's fixed indexed annuities.
• Help clients understand complex concepts in minutes instead of hours making real-time adjustments that match your clients' specific situations.

Customize Solutions
for Every Client
• Adjust variables in real-time like withdrawals and contributions demonstrating how retirement savings grow and persist through the markets ups and downs.
• Illustrate income changes during market volatility and fine-tune risk levels from 0% to 3% to match client comfort levels.
Backed by a
Legacy of Trust
• Founded in 1892, GBU Life has been offering life insurance & annuity products for over 130 years.
• AM Best recognized GBU Life's fiscal responsibility and growth, giving it an A- Excellent rating. (1)
(1) Third party ratings are subject to change. For the latest Best's Credit Rating, access:
www.ambest.com
Show Clients the Power of Protected Growth:
Get FREE Access to The Real Return Reporter™ Software

Your Complete Success
Package Includes:
✓ Immediate access to the web-based Real Return Reporter™ software
✓ Comprehensive 11-page guide for step-by-step client presentation
✓ Weekly expert training calls for maximizing software effectiveness
✓ ALL THE ABOVE at No cost, No obligation - completely FREE for financial professionals
READY TO START IN MINUTES...
• Web-based platform - no downloads required
• Works on all devices (desktop, tablet, mobile)
• Instant access upon registration
• Simple, intuitive interface
Get Immediate Access To Your Free Software Package
Quick Links
© Copyright 2025 SMART Publishing DBA Real Return Reporter™. All rights reserved.